- Introduction
- NaC Introduction
- Manual Validation
- CXTM Introduction
- CXTM Projects
- CXTM Test Cases
- CXTM Test Automation
- CXTM Git Integration
- CXTM Batches
- CXTM Notifications
- Final Deployment
- CXTM Reporting
- CXTM References
- Bonus Content
Project Dashboard
Step 1 - Navigate back to your CXTM Project homepage
From your Job File Results page:
-
Navigate back to your project home by clicking on the Project LTROPS-2711 tab in the navigation
breadcrumbs.

Step 2 - Review Project Dashboard
From your CXTM project's Home page:
-
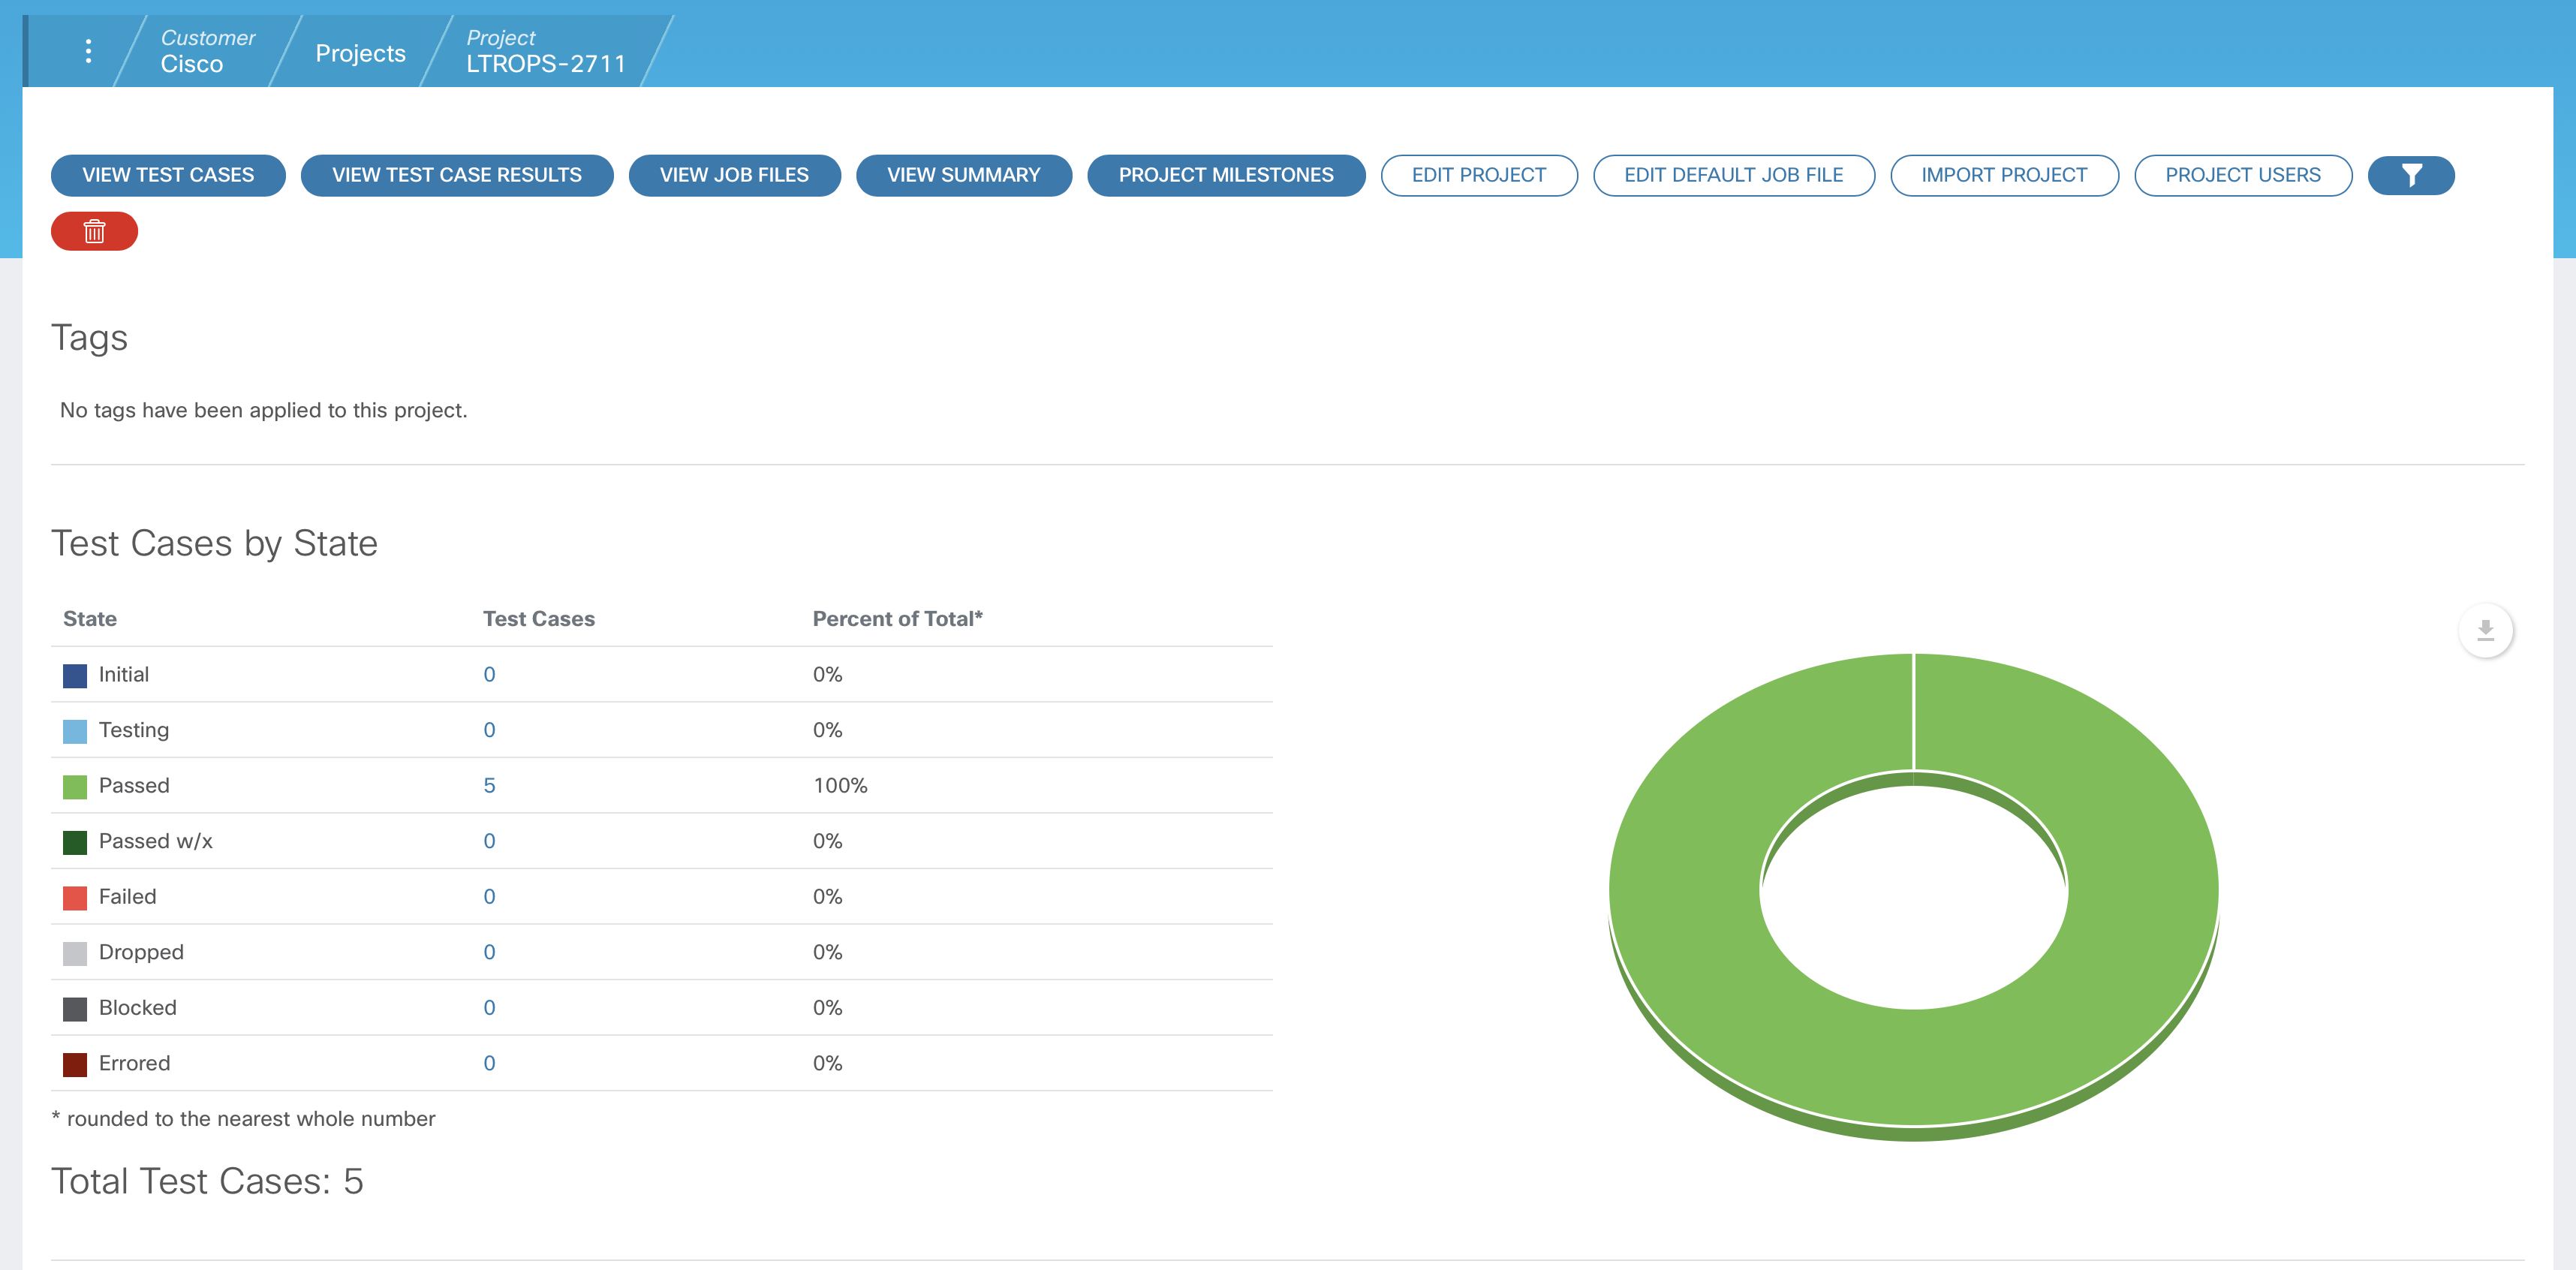
Review the Test Cases by State table and chart
The last time you reviewed the Project dashboard, your project had test cases both in the "Initial" and "Passed" state.
Now that all of the test cases have been executed, your project dashboard should reflect all test cases in the "Passed" state.
-
Hover over the "down button" icon to the right of the Test Cases by State donut chart
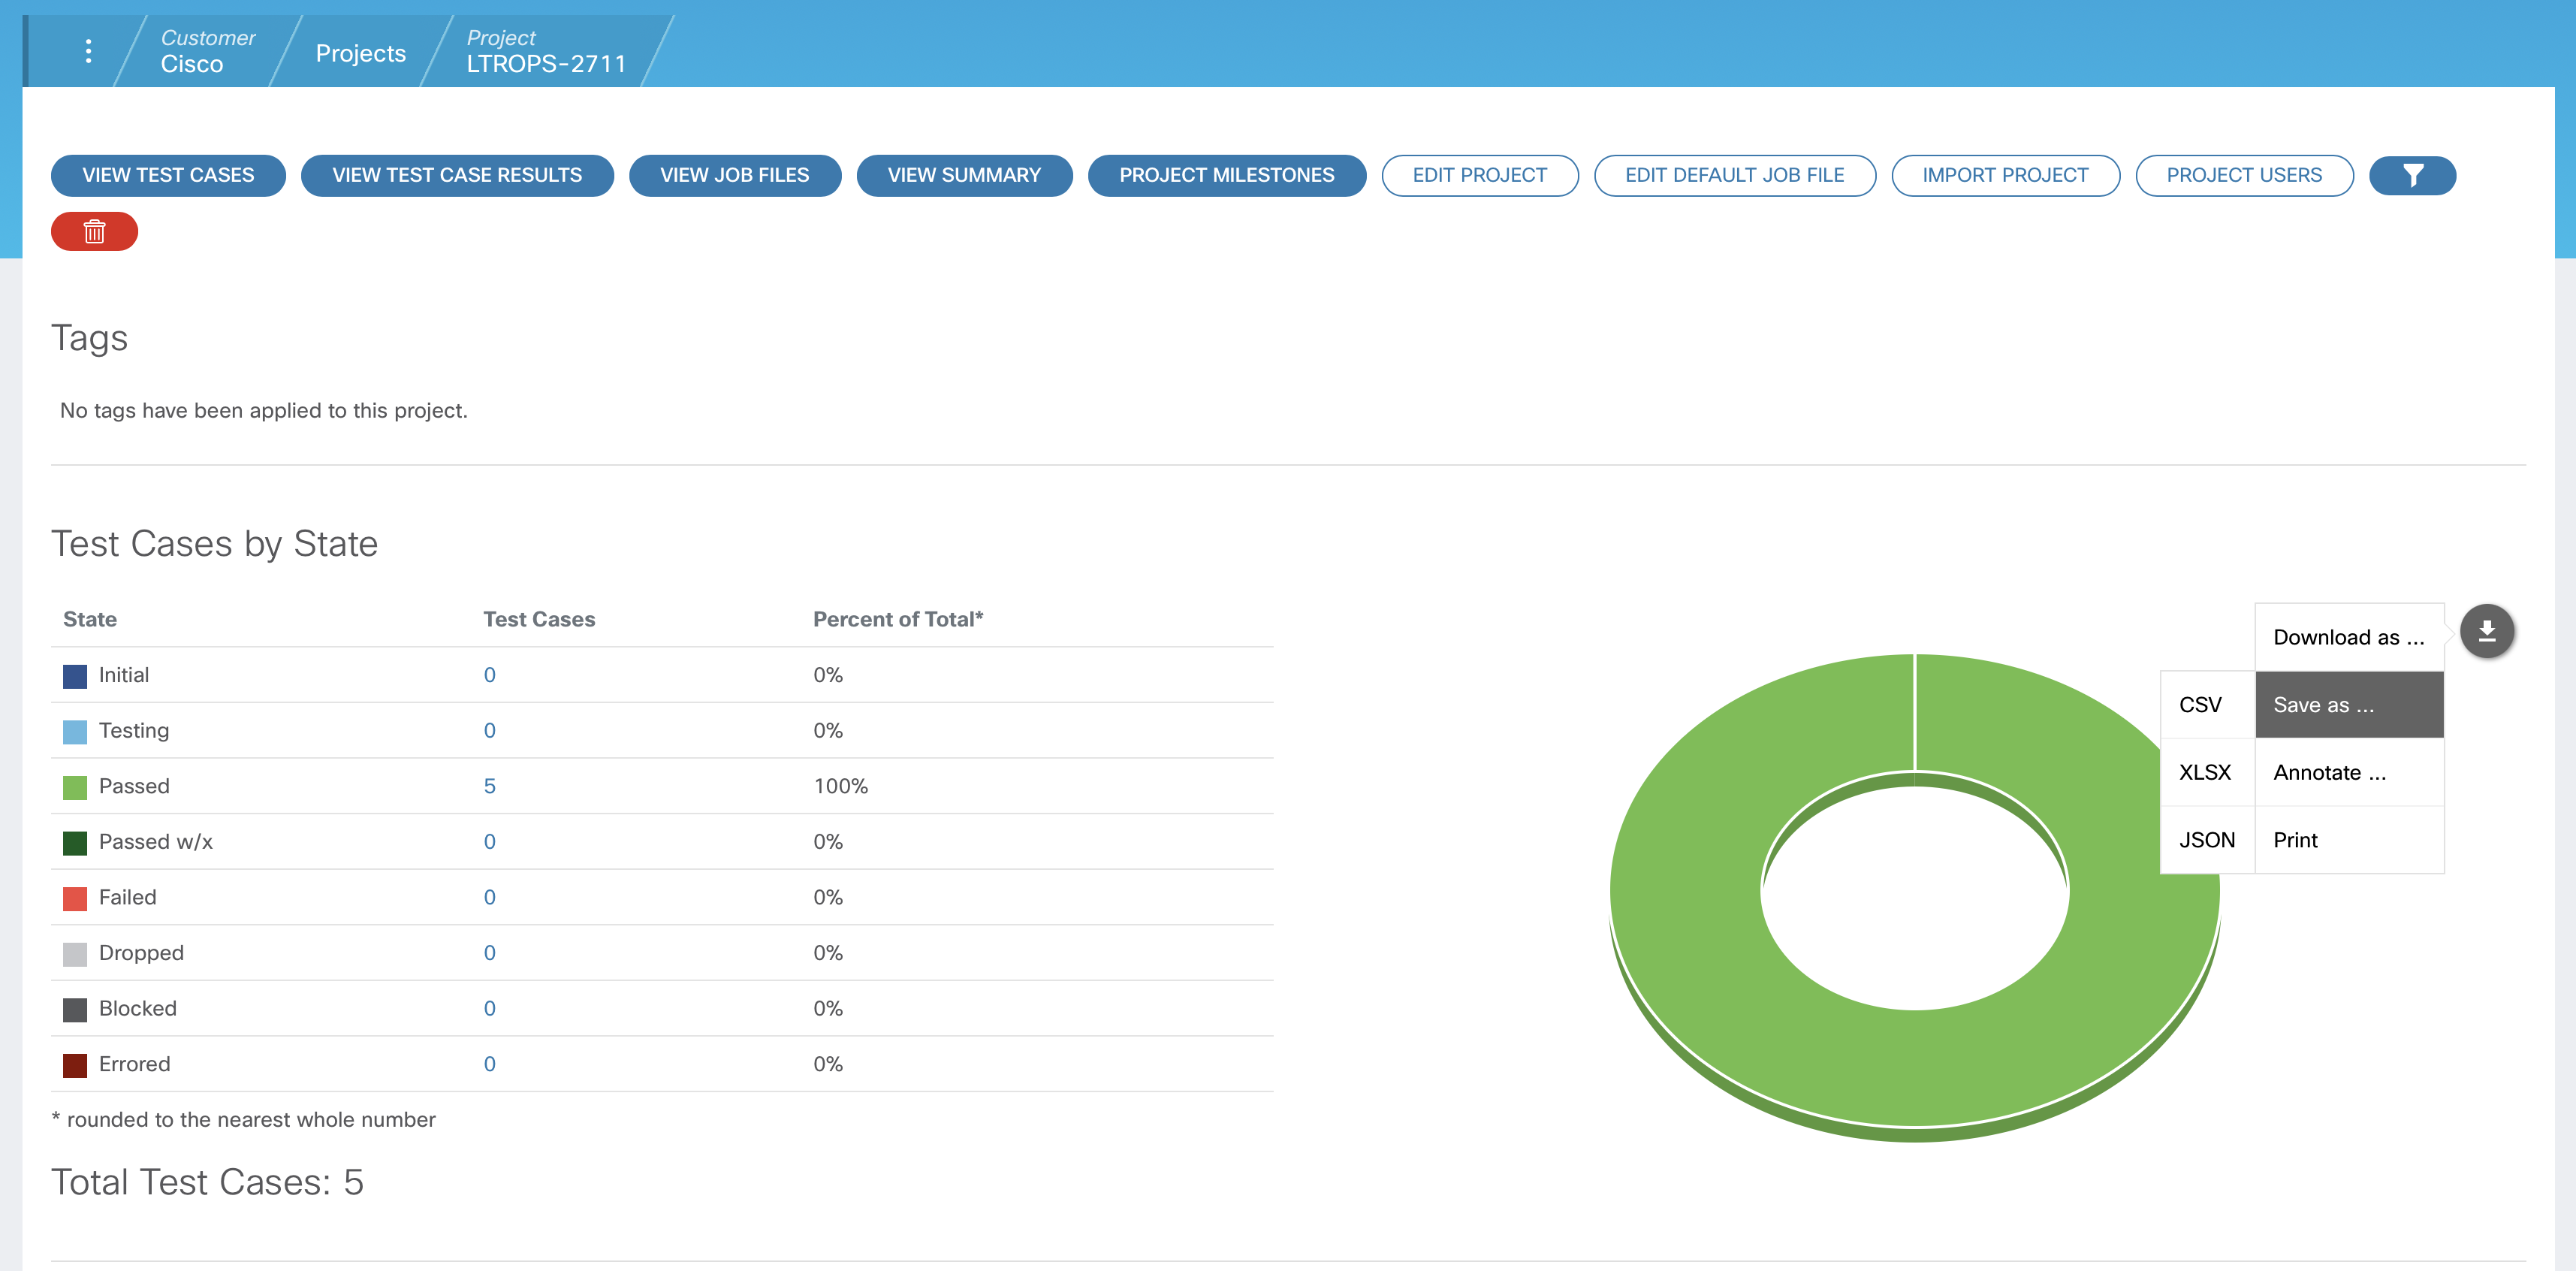
Notice that this chart, and others, can be downloaded in various image formats, or the raw data saved in various formats for
reporting and offline post-processing purposes.
-
Review the Test Cases by Phase and State and the Test Cases by Suite and State charts.
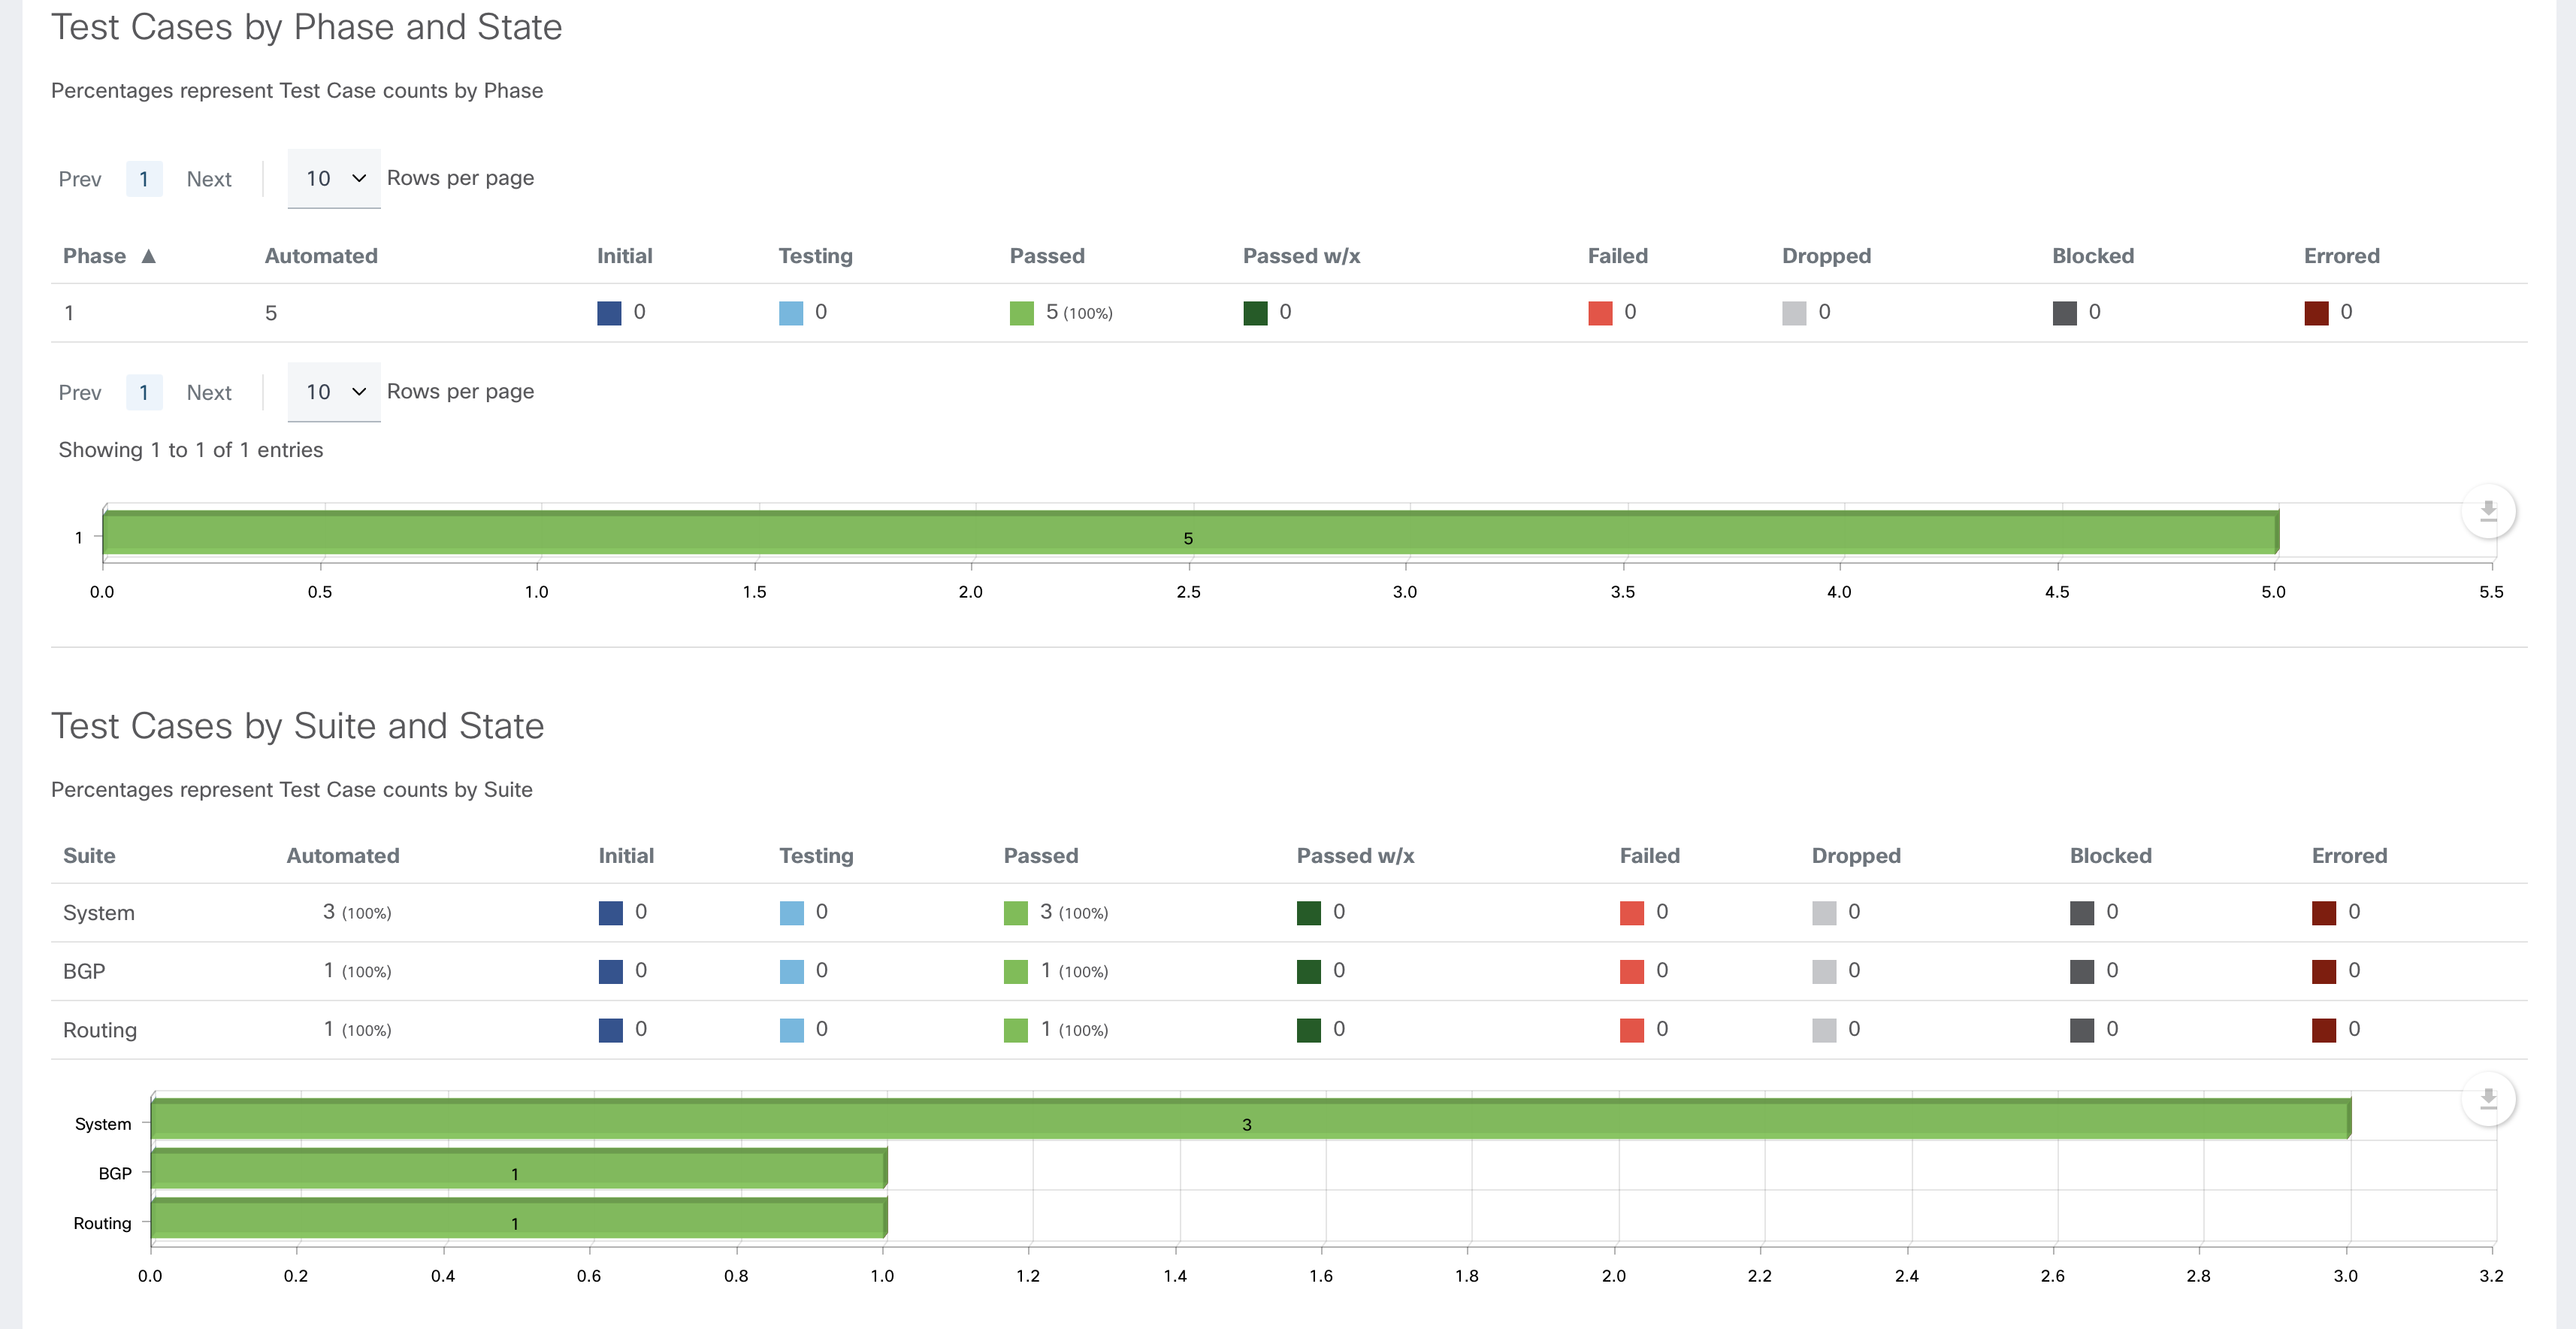
The dashboard in your project is built from a relatively small amount of data in terms of the number of test
cases and project duration. The visual impact may understandably feel underwhelming. However, having real-time reporting for
large, complex projects is valuable to interested stakeholders and frees up resources from having to provide reports manually.
Take moment to scroll down the page and review the other charts provided on the Project dashboard. The Test Cases Completed
chart, a burn up chart, and the Test Case State History chart are both useful for measuring the project's progress.
Continue to the next section to explore the project's End of Test reporting.